There are many requirements (quality, regulatory, technical) that have to be met when designing new single-use systems. Following industry standards, such as ASTM E3051, BioPhorum and BPSA have created templates to walk end-users and suppliers through the SU design process. Templates for download as part of the Toolkit cover Single-Use User Requirements (SUUR), Technical Diligence and Supply Chain.
User Requirements Template: Facilitates clear communication of process/application needs and supplier capabilities.
Supply Chain Template: Enhances transparency and risk management of the SUS supply chain.
Technical Diligence Template: Provides detailed, pre-populated forms for assessing supplier responses.
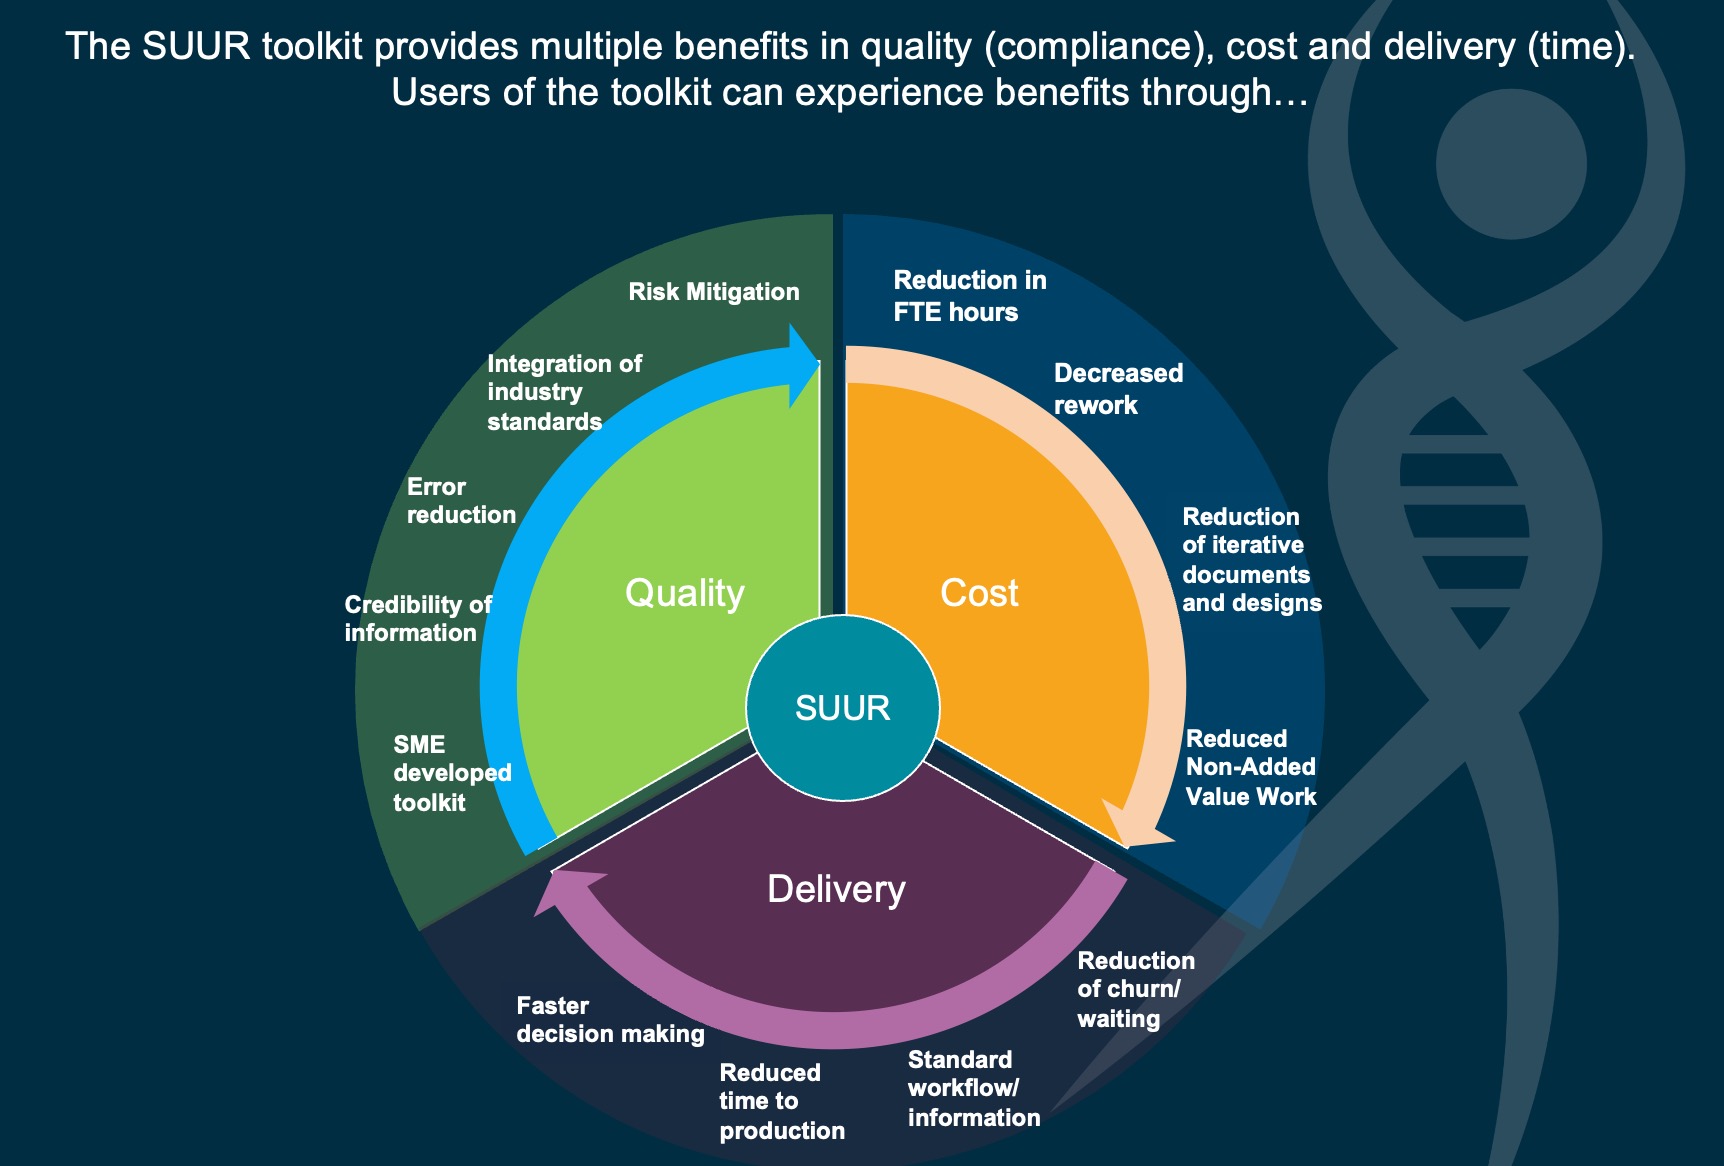
Benefits
The SUUR Toolkit offers benefits in terms of quality, cost, and delivery:
Reduction in Full-Time Equivalent (FTE) hours.
Decrease in churn and waiting times.
Reduction in rework and time to production.
Error reduction and risk mitigation.
Standardized workflow and faster decision-making.
Integration of industry standards.
Industry Feedback
Feedback from industry professionals emphasizes:
Reduced compliance risks and project timelines.
Accelerated delivery and cost savings.
Standardized and structured communication between users and suppliers.
The SUUR Toolkit offers a transformative approach to the design and implementation of single-use systems, enabling improved communication, risk mitigation, and efficiency. By standardizing workflows and aligning user requirements with supplier capabilities, it reduces compliance risks, saves time, and minimizes resource use. The collaboration between industry experts ensures the toolkit’s credibility and adaptability, making it a vital resource for streamlining processes and achieving better outcomes in single-use system projects.
Our application engineers have been involved in the design and implementation of single-use filling systems for years. During INTERPHEX New York, Max takes a look at some of the inherent challenges in terms of system complexity, dosing accuracy and sterility assurance.
The CryoVault® Freeze & Thaw Platform for Biopharmaceuticals
The CryoVault® Platform provides an end-to-end solution for your entire freeze-thaw process, from fill to dispense. The modular platform is composed of four components: single-use assemblies, freeze-thaw equipment, distribution options, and material handling infrastructure.
FOR IMMEDIATE RELEASE Meissner Acquires PDC Aseptic Filling Systems
Meissner Filtration Products announced that it has acquired PDC Aseptic Filling Systems, a supplier of advanced aseptic filling systems and sealers to the pharmaceutical industry.
“PDC’s technology is a natural extension of our current portfolio and fits with our trajectory as pertains to providing automated platforms that enable robust pharmaceutical processing operations” stated Chris Meissner, CEO of Meissner. “We are committed to providing our clients with process solutions that reduce risk, while at the same time enhance productivity, and this makes PDC a great fit for our organization.”
PDC Aseptic Filling Systems products will complement Meissner’s current process solutions portfolio which include filtration, single-use systems fluid handling and unit processing offerings. The filling systems enable automated aseptic filing of pharmaceutical process liquids, which are essential to drug manufacturing processes, while the innovative sealing equipment reduces cycle times associated with aseptic disconnections.
About Meissner Filtration Products – Meissner develops, manufactures, supplies and services advanced microfiltration and single-use systems worldwide. Meissner’s product portfolios are built upon a solid foundation of quality, operational excellence and technical expertise that allows them to deliver high performance products and technical support services for their clients’ critical applications.
The speed with which homogeneity is reached within solutions is a critical performance attribute of single-use mixing systems. These systems are commonly used in biopharmaceutical and pharmaceutical media and buffer preparation processes, often involving the hydration of a powder. Recirculation mixing performed using a peristaltic pump can provide a simple and cost effective alternative to more elaborate mixing systems such as those which incorporate a magnetically driven impeller.
This technical bulletin highlights the results of conductivity testing to characterize recirculation mixing performance of single-use systems deployed in Meissner’s QuaDrum® rigid outer containers (ROCs). All three standard QuaDrum® ROCs, with nominally rated volumes of 50 L, 100 L and 200 L, were evaluated with corresponding single-use systems. The scope of this testing included varying flow rates and mixing directions while using NaCl as the mixing solute.
Materials and Methods
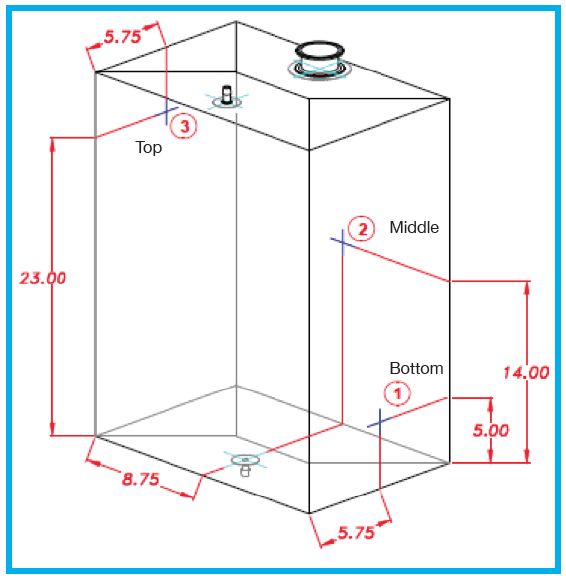
Electronic conductivity meters (Mettler Toledo InPro 7108-TC-VP and InPro 7100) were mounted and sealed into locations which allowed for data capture at the top, middle and bottom of 50 L, 100 L and 200 L biocontainers deployed in QuaDrum® ROCs (as
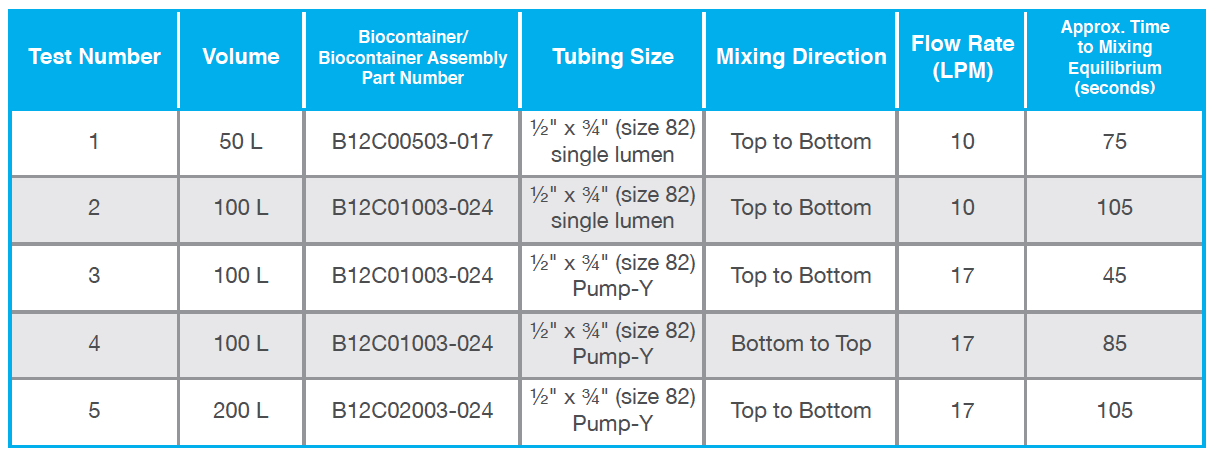
shown by the drawing in Figure 1). The QuaDrum® ROCs used for this testing included the optional bottom drain version (part numbers FASD-050B, FASD-100B and FASD-200B) which was installed on their corresponding accessory dollies to facilitate the use of a bottom mounted fluid path. A volume of water equivalent to the nominally rated capacity of each (i.e. 50 L, 100 L or 200 L) was added to each single-use assembly. The recirculation flow was established using a Masterflex® I/P peristaltic pump set to the desired rate that was verified via an offline measurement. Mixing direction was controlled based on the direction of recirculation flow through the assembly and was either top to bottom (i.e. fluid evacuated from the top of the closed system and returned through the bottom port) or bottom to top (i.e. fluid evacuated from the bottom of the closed system and returned through the top port). NaCl (VWR GR ACS Sodium Chloride) was introduced into the system through a large bore 3″ TC top port in the quantity necessary to achieve a concentration of 15 g/L for the given fluid volume. The system was allowed to mix until all three of the conductivity readings were stable. Five tests were conducted, which included analysis of all three fluid volumes with varying flow rates and mixing directions. The specific test conditions are presented in Table 1.
Table 1: Conductivity Tests for QuaDrum® Mixing Assemblies
Results and Discussions
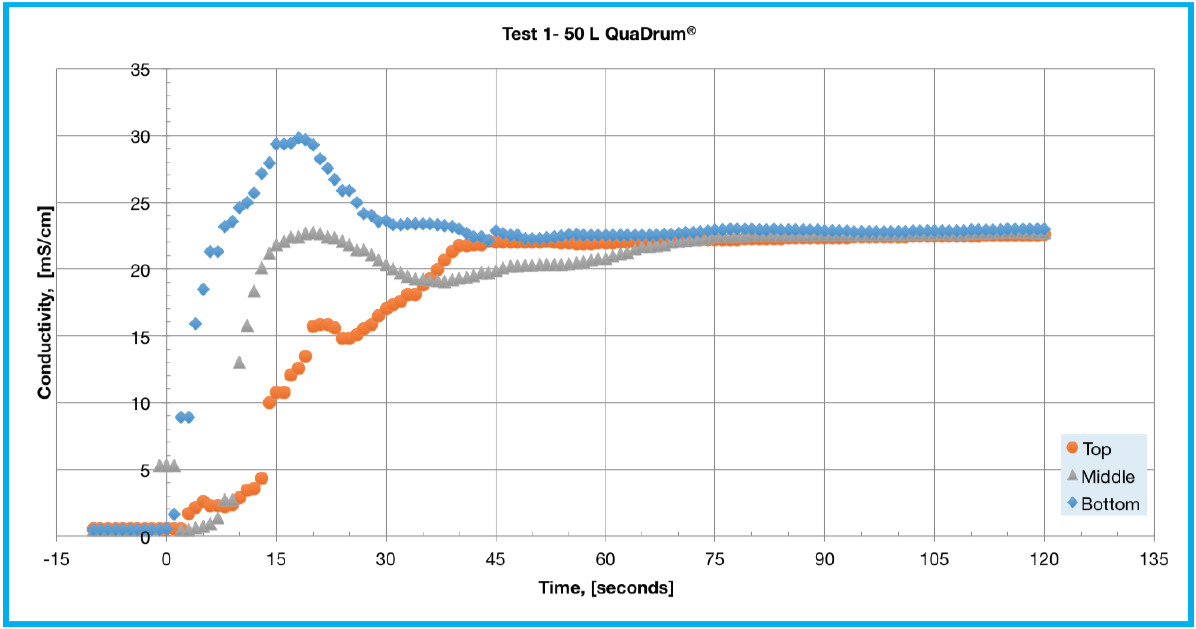
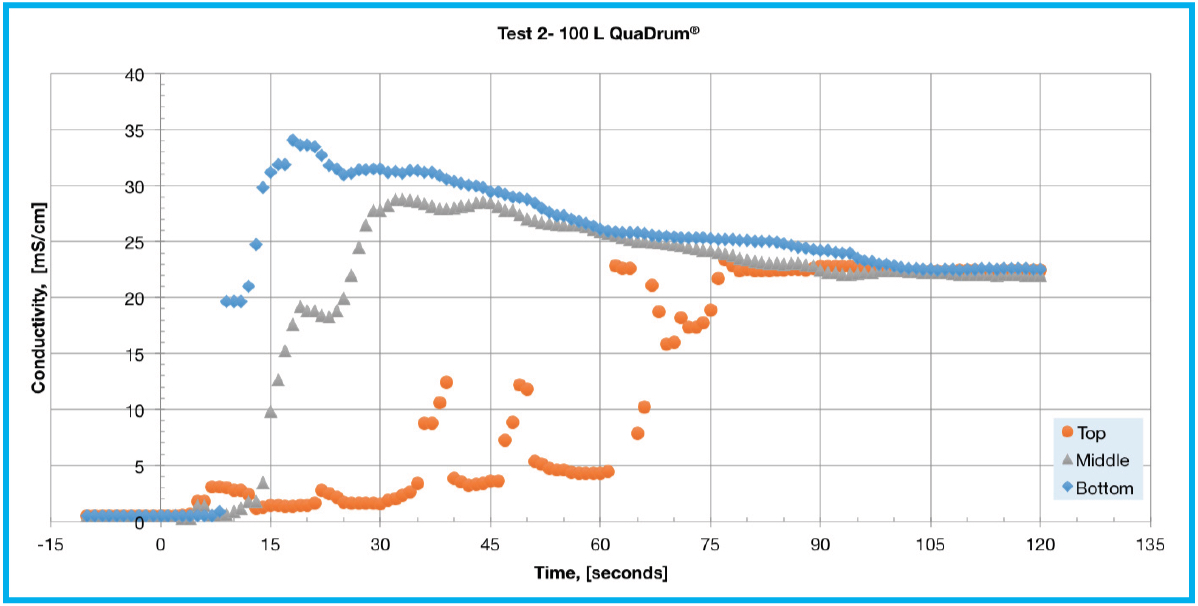
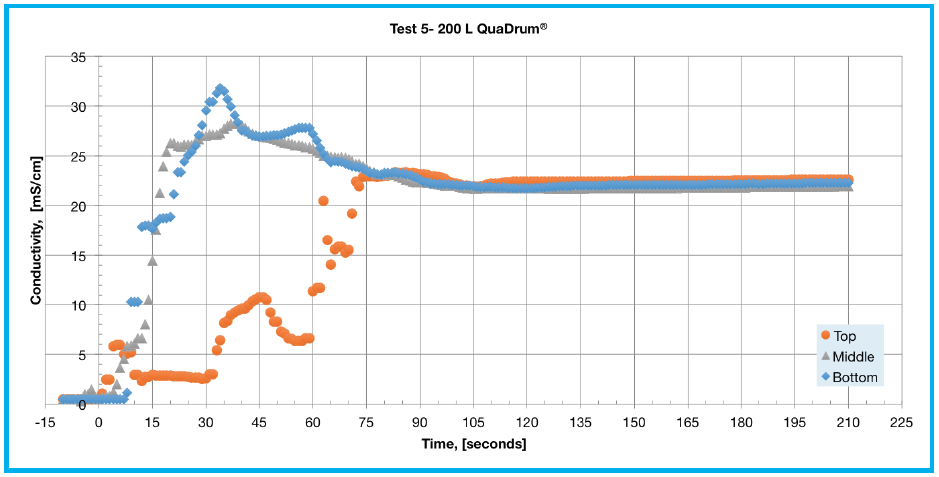
The conductivity testing results are presented in Table 1 and Figure 2. The response from the bottom sensor displayed a characteristic overshoot before settling to equilibrium for each of the test conditions. This can be explained due to initial NaCl accumulation near the bottom of the biocontainer immediately following solute addition. The middle level sensor also followed a similar response to that of the bottom sensor but with a smaller overshoot. The top sensor displayed a varied response based on the specific test being performed. During tests 1 and 4 the top sensor gradually approached the equilibrium conductivity value while during tests 2 and 5 it displayed a delayed response with a few spikes in conductivity. In Test 1 (Figure 2A), all three sensors reached equilibrium conductivity at about 75 seconds and follow the general patterns described above. Test 2 (Figure 2B), showed an unusual response from the top sensor, which spiked around 35, 47, and 63 seconds.
Figure 1. Drawing of a 100 L biocontainer showing the placement of mounted conductivity sensors at top, middle and bottom locations.
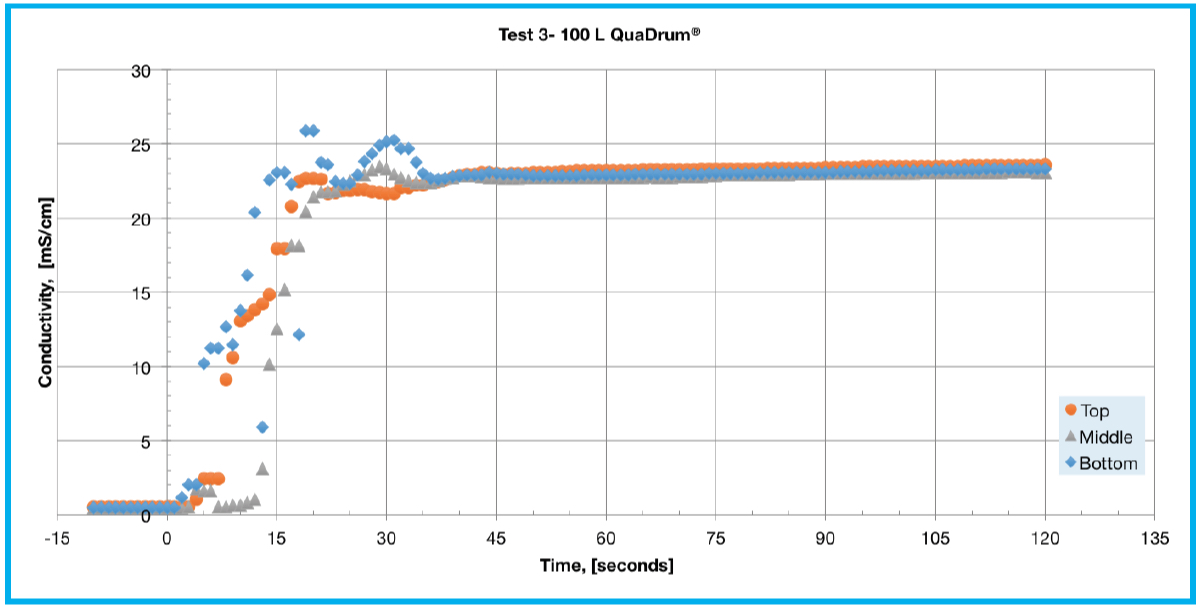
This is likely due to a relatively low flow rate for the larger liquid volume with a time to equilibrium of 105 seconds. Tests 3 and 4 (Figures 2C and 2D) examine the effect of recirculation flow direction on a 100 L single-use assembly deployed in a QuaDrum® ROC. These tests were performed using a pump-Y element, as opposed to a single lumen pump tubing segment, in order to achieve an increased flow rate of 17 LPM. The difference in performance is significant as it took 45 seconds to reach equilibrium for top to bottom recirculation, whereas bottom to top recirculation took 85 seconds. In Test 5 (Figure 2E), all three sensors reached equilibrium at around 105 seconds. The response of Test 5 appears similar to that shown in Test 2, with an overshoot at the bottom and middle with a delayed response at the top sensor. This is explained by the bottom becoming heavily concentrated while the top experienced mixed concentration levels. At a flow rate of 17 LPM, the 200 L mixing assembly takes a few minutes of mixing to reach a consistent concentration level.
Conclusion
The results of conductivity testing using QuaDrum® ROC based single-use mixing assemblies indicate that achieving an evenly mixed solution within a relatively quick period of time is possible using this technique. The testing shows the significance of using an appropriate flow rate predicated on the overall volume of the system. It further demonstrates that for powdered solutes with a specific gravity greater than one, employing a mixing direction that circulates fluid from the top of the system and returns it to the base, is preferable. Therefore, under the appropriate operating conditions, recirculation mixing using QuaDrum® ROCs with installed single-use biocontainer assemblies can provide an effective means to achieve and maintain homogenous solutions.
Figure 2A. Test 1 – 50 L assembly with top to bottom mixing at 10 LPM flow rateFigure 2B. Test 2 – 100 L assembly with top to bottom mixing at 10 LPM flow rateFigure 2C. Test 3 – 100 L assembly with top to bottom mixing at 17 LPM flow rateFigure 2E. Test 5 – 200 L assembly with top to bottom mixing at 17 LPM flow rate
Recirculation Flow Testing a FlexGro® Biocontainer Fitted with an Anchored Dip Tube for Perfusion Culture
Introduction
Perfusion processes are rapidly being adopted as an alternative to traditional batch and fed batch culturing of mammalian cells. In one type of perfusion system, a bioreactor is connected to a recirculation pathway where the exchange of spent media occurs. Rocker bioreactors, also commonly referred to as wave bioreactors, have been a popular choice for seed train applications and small scale protein production for required working volumes below the 100 L range. The continuous rocking motion of the reactor generates a wave inside of a single-use biocontainer, allowing aeration of the cell culture while avoiding problematic high shear conditions. However, one commonly encountered challenge of using rocker bioreactors in perfusion mode is the undesirable transfer of air into the recirculation pathway. These entrapped air bubbles compromise the effectiveness of the perfusion filter, which is usually accomplished via either a tangential flow filtration (TFF) or an alternating tangential flow filtration (ATF) device. This technical bulletin evaluates a solution to enable perfusion culture via a new anchored dip tube that was designed to prevent air migration into the recirculation pathway. A 50 L FlexGro® biocontainer connected to a recirculation loop was tested for the presence of entrapped air under varying processing conditions of liquid volume, rocking rate, and rocking angle. The experimental data provides insights into the relationship between liquid volume, rocking rate, and rocking angle, which is useful in defining the proven acceptable range (PAR) of processing parameters for the perfusion system.
Materials and Methods
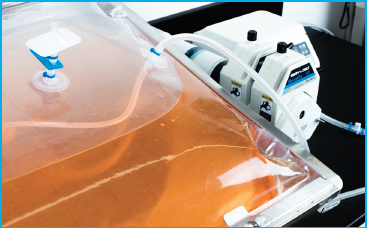
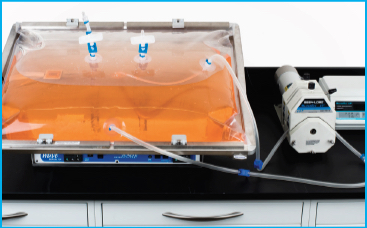
A Meissner 50 L FlexGro® biocontainer (part number B12R00505-006) modified to incorporate a ¼” x 7/16″ (ID x OD) anchored dip tube was mounted to a rocker bioreactor (GEHC, Wave Bioreactor 20/50 system), filled with dyed water, and inflated with air to approximately 1 psi, according to the manufacturers instructions. A recirculation flow pathway comprised of transparent silicone tubing was then established by interconnecting the inlet and outlet tubing. A peristaltic pump (Masterflex® I/P) was used to maintain a constant recirculation flow rate of 8 L/min. The testing setup is shown in Figure 1. Rocking angles of 6-10°, rocking rates of 15-35 rpm, and liquid volumes of 10-25 L were used in combination to determine whether air transfer into the recirculation pathway occurred. Table 1 summarizes the testing parameters. The recirculation pathway was visually inspected for migration of air bubbles for each of the operational combinations tested.
Table 1: Recirculation flow testing parameters to asses air entrapment in recirculation loop
Results and Discussions
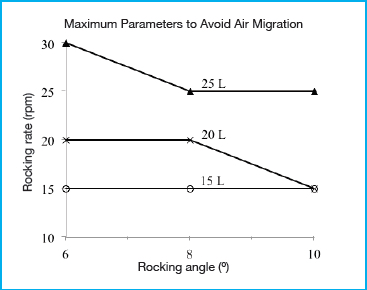
The graph presented in Figure 2 shows the maximum rocking rate determined as a function of rocking angle and working volume before air migration occurred. A recirculation flow rate of 8 L/min was used in order to represent worst case conditions and amplify the migration of air through the tubing. As hypothesized, the rocking angle, rocking rate, and working volume all had an effect on the transfer of air into the tubing. An increase in rocking angle and rocking rate contributed to increased air transfer, while a decrease in liquid volume also led to an increase in air transfer. To prevent air migration, meeting two conditions seemed to be crucial. First, the anchored dip tube must remain submerged below the liquid level at all times. Second, the liquid near the dip tube cannot contain air bubbles. All three operating parameters of volume, rocking angle, and rocking rate contributed to whether the first condition was met. Although the anchored dip tube was positioned along the centerline of the biocontainer, air entrapment still occurred under certain conditions, even when the highest working volume of 25 L was used. When the rocking rate was increased high enough (above 30 rpm for an angle of 8° or greater) the inertial forces generated caused the bulk of the wave to move beyond the centerline, resulting in a liquid level below the anchored dip tube inlet opening. The primary contributor to whether the second condition is met is the rocking rate. At higher rocking rates, increased agitation resulted in turbulent flow patterns, which produced air bubbles in the liquid. It is likely that this effect will be further exacerbated during actual cell culture due to the generation of foam. It is expected that the 50 L biocontainer used is representative of a worst case condition when compared to the smaller 20 L and 10 L FlexGro® biocontainers because the effect of the inertial forces in generating turbulent mixing and agitation is expected to decrease at lower volumes.
Conclusion
A 50 L FlexGro® biocontainer modified with a centerline dip tube to effect a recirculation loop supports its use in perfusion applications, provided that the operational culture conditions used remain within the PAR to avoid air entrapment. Further experimental evaluation may be required using actual cell culture conditions in order to define a normal operating range (NOR) of operational parameters suitable for perfusion culture. Therefore, the results presented in this technical bulletin should only serve as an initial guide towards the adoption of FlexGro® biocontainers for perfusion culture.
Figure 1. Recirculation flow testing setup of a 50 L FlexGro® biocontainer equipped with an anchored dip tube and mounted on a WAVE Bioreactor system 20/50.Figure 2. Maximum operational rocking rate as a function of rocking angle and working volume in order to avoid occurrence of air migration into dip tube.